If nothing else, I concluded a fun goal and perseverance is required in this hobby when you embark on a crazy mission.
February 2019 From the control program on my laptop, I clicked a button to have the payload take a selfie. The Selfie camera beeped to indicate it had started recording. The whine of a gear motor followed as the Selfie camera pushed away from the payload. The control program indicated the arm holding the Selfie camera extended and, after ten seconds, was retrieved. Three beeps from the Selfie camera said the recording had stopped. With this success of the primary mission objective of this payload, I wondered, could I schedule a launch for the Summer?
The winch extends the arm, waits ten seconds, and retrieves the arm. In a flight configuration, the selfie camera would be mounted on the arm. In addition to the winch moving the arm out and back, you might see the camera blinking (lower left) as it is recording, the wi-fi chip blinking blue (upper right) as it receives data from the camera, and the GPS blinking (upper center). The light just up and to the left of the winch indicates direction; blue is extend and yellow is retrieve.
How Did I Get Here? Since my first flight in 2008, I gained more experience over seven succeeding weather balloon flights. Additionally, I was on launch and chase teams for flights with others in the hobby. I enjoyed the launches, the recoveries, and chases through rural Ohio for a bit of fun with science. Each flight was a unique experience but I was ready for a more challenging mission. I knew I would need better hardware. As first reported here and subsequent posts, I started experimenting with an improved GPS, 900 MHz radios, and Arduinos. By August 2014, I had a reliable payload/base station system to serve as the backbone for my next mission.
Challenge Accepted In the early 2010s, cell phones with front-facing cameras were abundant. Sometime during October 2013, I had an inspiration. We have seen many beautiful images from the edge of space but may have overlooked the engineering needed to take them. A Selfie Mission could change that by focusing on the payload. Over the succeeding months, I defined a mission to extend an arm from a payload and take a selfie.
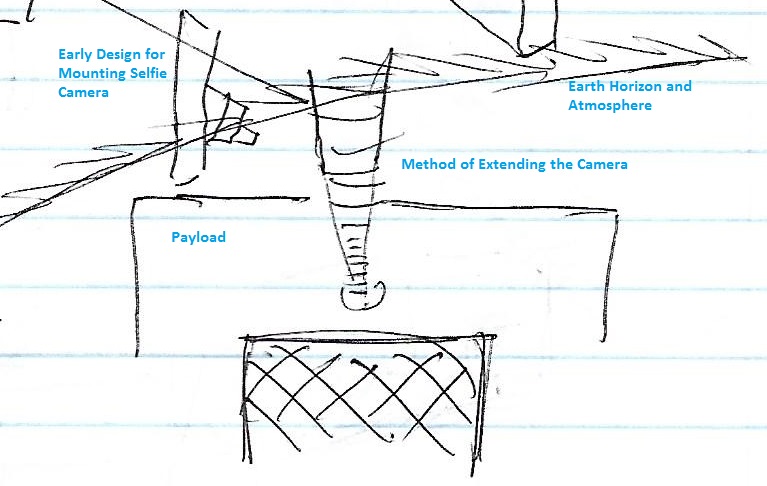
I drew this to help visualize how a payload selfie might appear. The “Early Design for Mounting Selfie Camera” (upper left) happens to be on the same piece of paper; that design grew into something very different.
How Do I Extend and Retrieve a Camera From a Payload? The design and construction of a payload is challenging. Designing and constructing a payload with an electro-mechanical arm controlled from the ground is, in hindsight, ambitious. My first approach to this design question was to use a long, threaded metal dowel rod known as a lead screw. I bought a three foot lead screw at Home Depot and attached it to my power drill. I discovered it required too much time to extend and retrieve a camera. While there were lead screws available with steeper threading to improve the out-and-back time, they were expensive. Also, I was hesitant to have a lead screw protruding from the payload for the whole flight. During my research for alternatives, I found a design using PVC pipes. One PVC pipe fit inside another and was made to move out and back using string and a winch. An accompanying video showed this in a small, underwater, remote control vessel, but I thought the design could be adapted for my mission’s purpose.
But Weight As the final components of the payload were identified, I had a concern about weight. After reviewing the regulations, I bought a scale. With just four months before the start of Summer, the payload needed to lose weight. I drilled many, many holes in the PVC pipes, found lighter batteries, found lighter rip-stop nylon, used Styrofoam in place of foam core, changed the shape of the payload from a cube to fit the form of the arm, and split the payload into separate enclosures (a Primary and a Secondary). Finally, the mission payload was ready to fly.
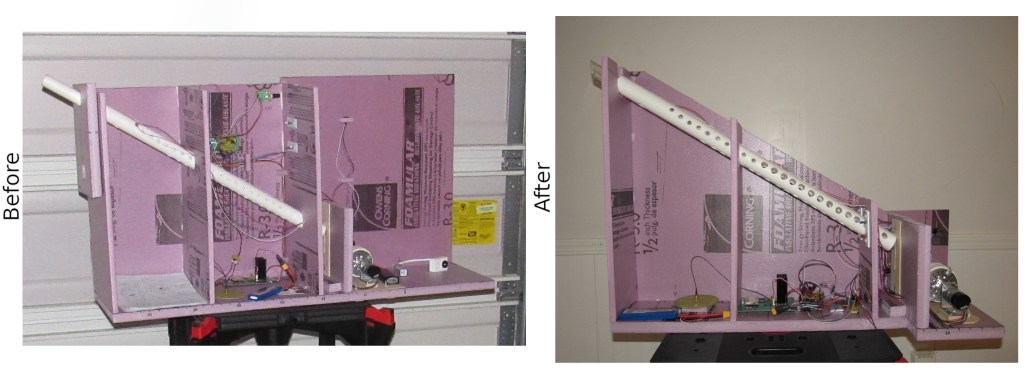
At left, the payload is shown as it was used during proof of operations stage of the construction. At right, the payload is shown after the weight reduction effort and before the port walls were added.
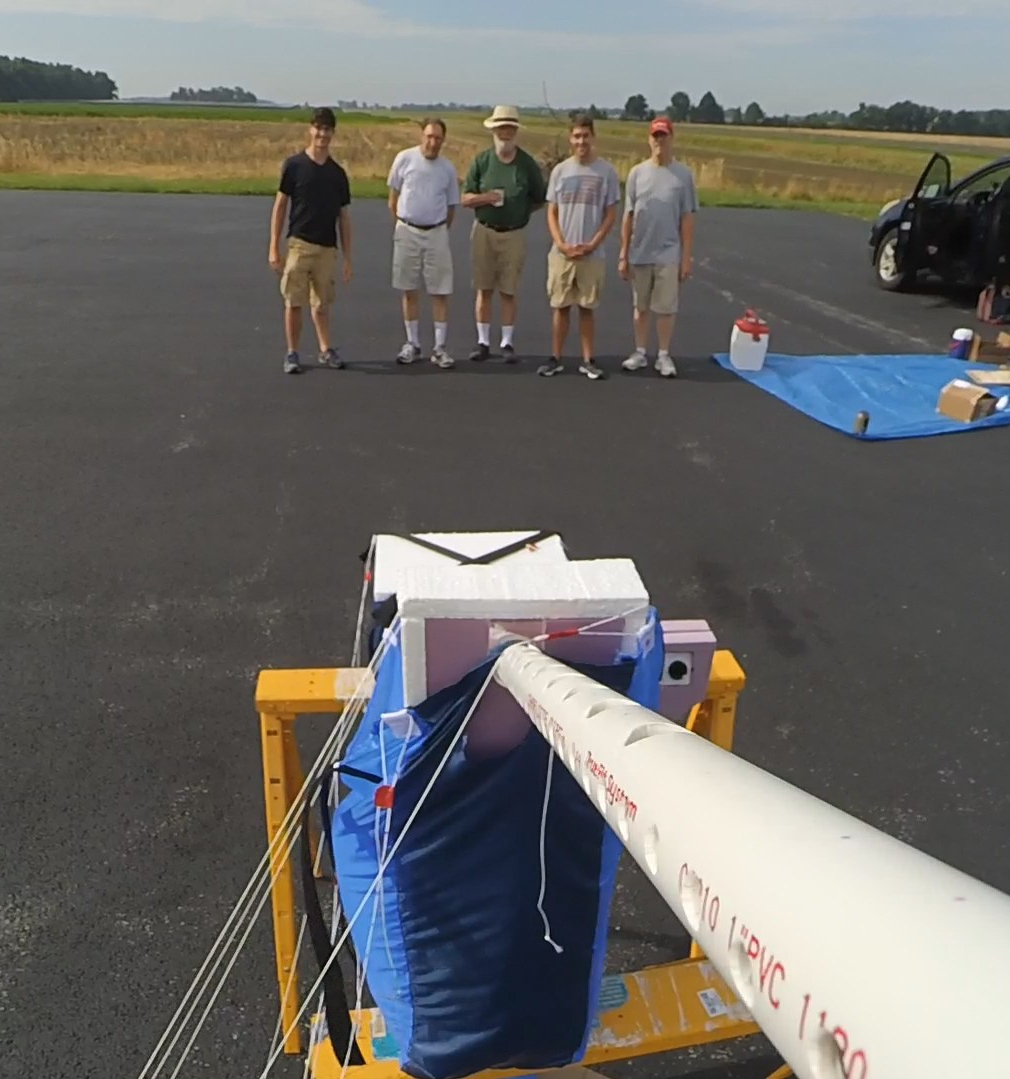
20 Jul 2019, Flight Day We arrived at the launch site early. As the launch team started inflating the balloon, I prepared the payload nearby. The stack included the Primary payload (contains the arm assembly and winch, GPS, the Selfie camera, and a witness camera), a Secondary payload (connected to the Primary by an umbilical of wires; contains the flight computer, radio, and antenna), a back-up tracking payload, and a cut down assembly (a back-up flight termination method). When it was ready, I assembled the launch team for a quick picture using the Selfie Sequence.
The Launch Team and the Payload
By late morning, surface winds had picked up and were blowing the balloon around. When the inflation was complete, we heard a small hissing sound. Having discovered a small hole in the balloon, we scrubbed the mission.
20 Aug 2019, Flight Day Again The alarm felt early as it always did on flight day. I slept a little that night and I was apprehensive. I had looked forward to launching this very complex payload for five years. If you have launched a weather balloon payload, you know what this day means. I prepared the payload stack as I did the month before. The balloon inflation completed quickly and without incident. Using a smaller balloon and more Hydrogen, there was a determined pull upwards and was the reason I brought a cement block. However, even after securing the balloon to the cement block someone had to sit on the block until launch time. While we were waiting for the GPS to lock, we heard an odd scratching sound. I looked at the block and saw the latch pin had not been latched. The tug of the balloon had deformed the latch pin and scraped it against the cement block. Having nearly lost the balloon, we fixed the latch pin and secured it again. When we closed the payload hatch, the control program showed the payload was online and the GPS was locked. We removed the balloon from the cement block and attached it to the stack. We carefully allowed the balloon to lift each component until I held the Primary payload. I walked to an open area of the tarmac and looked up. Countless hours of effort were about to journey into the upper atmosphere. I let go of my payload.
Launch!
Time paused as we watched the balloon ascend into the blue sky. I noticed it was rising fast so I jogged to my laptop and clicked the Selfie button but the control program showed no reaction. I realized the payload was offline. I pointed the long range but narrow beamed Yagi antenna towards my payload but could not re-establish the connection. I received tracking data from the back-up tracking system for the next 90 minutes as we chased the balloon. We stopped many times to aim the Yagi and attempt a selfie without success. As the flight continued, my thoughts were, unfortunately, planning another launch. We recovered the payload in a bean field (normal for a late Summer flight in Ohio). The failure to take a selfie was disappointing but I was happy to have launched and retrieved the payload without damage. It could fly again. Once home, I inspected the payload. The power cable to the radio had disconnected. It may have been that the umbilical from the Primary to the Secondary payload was too short or the strings supporting the Secondary were too long.
Could It Be? We reviewed the video from the Primary payload’s witness camera (mounted on the side of the payload). The files on the SD card showed it recorded the entire flight. We started with the burst thinking it would be the most interesting. In the near silence of high altitude, we heard a pop. The payload pitched upwards giving us a view of the balloon remnants against the bright sun. As the payload pitched back down and stabilized, air whistled by the camera as the payload accelerated towards Earth.
At just over 92,000 ft, the balloon burst is audible. The payload pitched and the witness camera captured bits of latex against the sun. The playback speed is purposely reduced to show balloon remnants.
About a minute later, the arm suddenly extended from the payload. I was concerned that the force from the air rushing past it was pulling it out. Since the arm was inside when the payload landed, we knew this was not true. After ten seconds, the arm retracted. That sequence looked very familiar. We scrambled to get the SD card out of the Selfie camera and into the computer, silently realizing what we might find. There were two recordings. We opened the first. An out-of-focus white blob. Then, a small click and low buzzing played over the speakers as the view opened to show the payload and a quilt of green behind it. I had the first selfie.
The first selfie of a weather balloon payload was taken at about 5,100 ft ASL during the initial ascent. The launch site, Wyandot County Airport, appears in the background just to the left of this unique payload. Note also the witness camera mounted in pink foam insulation.
We checked the second recording. A bassy wind rush roared out of the speakers as the camera extended to show the payload photo-bombed by the Earth and darkness of space. I was overwhelmed, elated, and confused. Without radio contact, how could the selfie sequence have executed?
The highest selfie of a weather balloon payload was taken at about 87,300 ft ASL just after the balloon burst. In the upper right, the outline of the southwest shore of Lake Erie is visible.
Epilogue Not satisfied with just having the selfies, I wanted to know how I got them. I set up the payload to match the flight configuration. After powering it up, I tried to induce noise into the payload wiring in an effort to trigger the Selfie Sequence. No matter what I tried, I was unable to trigger it. I am not certain how the Selfie Sequence was triggered during the flight. In the last year, I reflected on this experience. In addition to having no control of the Selfie Sequence, I could not monitor position, altitude, payload temperature or battery voltages from the primary tracking system. If I considered another mission, I thought I would capture this data on-board to back up the telemetry. I also thought it might be interesting to have an accelerometer to show both rate change and changes in payload pitch. While I demonstrated the ability of the flight computer to do both of those on the bench, I confess to a certain amount of satisfaction with my fortune in capturing a payload performing its function. Still, I have a lingering curiosity about the hardware that was not demonstrated. Another flight? We’ll see.
First Selfie About 5,100 ft above central Ohio. The view on the left is from the selfie camera. The view on the right is from the witness camera.
Highest Selfie About 87,300 ft. The view on the left is from the selfie camera. The view on the right is from the witness camera.
A Word of Thanks A weather balloon flight is not possible without a great team.
Thanks Tim for helping get the Hydrogen!
Thanks Doug for the use of some special tools!
Thanks to Natasha for the Secondary payload and back up telemetry payload jackets!
Thanks to Nino for the guidance, patience, and final construction of the Primary Payload jacket!
Flight Day was not possible without the help of this special crew.
Thanks to Wyandot County Airport for their hospitality!
Thanks to Dave and Tom for your contributions to the flight!
Thanks to my family for their support and assistance!
Flight statistics and technical details are provided below.
Flight Statistics
Flight Designation
Surfs Up 9
Launch Time
11:20 AM, 20 Aug 2019 Upon review of the flight computer data (498 data points), the launch was closer to 11:23:33.
Landing Time
1360 ft/min (final descent rate based on last two packets) 3783 ft (last reported altitude) To reach the landing site elevation, the payload fell for another 2:47. The last time reported was 13:03:21. The calculated landing time is 13:06:29.
Witness 1 YDXJ0423.mp4 starts at 12:54:03. Landing is time stamp 11:17. The calculated landing time is 13:05:20.
Selfie YDXJ1731.mp4 starts at 12:54:52. Landing is time stamp 10:29. The calculated landing time is 13:05:21.
Recovery Time
The video YDXJ1734.mp4 begins at 13:26:37. Dave yells “Here” at the 8:19 mark.
That makes discovery at 13:34:56. Recovery begins about two minutes later.
Team members removed the payload from the bean field. The payload was placed into the van around 13:55.
Maximum Height
The APRS packet time-stamped at 12:33:12 showed an altitude of 92024 ft. The next packet, 120 seconds later, showed an altitude of 76854 ft.
For the values shown, the initial descent rate is over 7500 ft/min. This is common after a burst. I’m concluding the maximum altitude was not much higher than 92024 ft. Based on the ascent rate between the previous packet and the highest altitude packet, the payload may have continued to rise another seven feet.
Initial Ascent Rate
The first two APRS packets show an altitude of 2559 ft (11:24:54) and 5062 ft (11:26:54) respectively.
The initial ascent rate was 1251 ft/min.
Average Descent Rate
12:33:12; 92024 ft (maximum altitude) 13:03:21; 3783 ft (last packet before landing)
Difference is 88241 ft. Time difference is 30:09 (1809 seconds).
Average: 48.77 ft/s, 2926 ft/min
Launch Coordinates
40.888.66 N, 83.31316 W, elevation of 823 ft
Landing Coordinates
40.7205 N, 82.94466 W, elevation 1020 ft
Distance Traveled
22.5 miles bearing 118 degrees from the launch site
Flight Duration
Based on the information from the flight computer for the launch time, the flight duration is 1:42:56.
Selfies
2 Selfies
Altitude: 5126 ft (estimated) Video File Start Time: 11:26:47 (from the Selfie SD card) Arm Fully Extended Time: 11:26:57 Arm Retrieved Time: 11:27:12
Altitude: 87346 ft (estimated) Video File Start Time: 12:33:41 (from the Selfie SD card) Arm Fully Extended Time: 12:33:49 Arm Retrieval Begins: 12:33:59 Arm Retrieved Time: 12:34:05
Burst
YDXJ0421.mp4 time stamp: 12:30:48
Cut Down
YDXJ1734.mp4 starts at 13:26:37. The cut down was reset at 11:00:00 and times out after 2.5 hours or 13:30:00. The sound, if detectable, should occur around 3:23 into the recording. The cut down occurs after landing but before recovery. There are clicks in the recording that match the profile of the cut down. A distinct click at 3:55 is followed about 8 seconds (4:03) later with a subtle click. In testing, the cut down was about 30 seconds past the design time out.
Battery Status 31 Aug 2019
Motor Battery: 12.4 volts Remote Radio Battery: 8.0 volts Base Radio Battery: 7.9 volts Base RS-232 Battery: 8.2 volts Flight Computer Battery (top): 3.7 volts Flight Computer Battery (bottom): 3.7 volts
We build our payloads to suit our missions and passions. There may be a design; more often there is a vision. When some part of the payload misbehaves, we can track down a cause and adjust some hardware or update some software. When some part of the payload fails, this sets me back. Is the time and expense still worth the pursuit of the mission?
In the past year, I decided to re-factor the hardware supporting my flight computer, I thought I lost a radio, and I recently lost a power supply.
I decided to swap the Arduino Pro for the Arduino Pro Mega. I decided I needed the extra performance. The form factor led me to believe the swap would be easy and the same program should operate without change.
As I investigated further, I found a voltage differences between the GPS and the Arduino, and between the Arduino and the radio. Fortunately, there was sufficient documentation to guide me through these design changes. Additionally, breakout boards made some of the voltage conversions very simple.
Over a one month period, I re-created schematics I thought I had somewhere, and re-created an Arduino class I had lost when my previous laptop gave out. I finally had a working set up.
While working on another part of the payload, the radios stopped communicating. I contacted the manufacturer who had me perform factory resets and other trouble-shooting. I thought I’d have to buy another pair of radios ($70/radio). Thinking about what I had most recently done, I replaced the wire between the antenna and the radio. The radios were on speaking terms again.
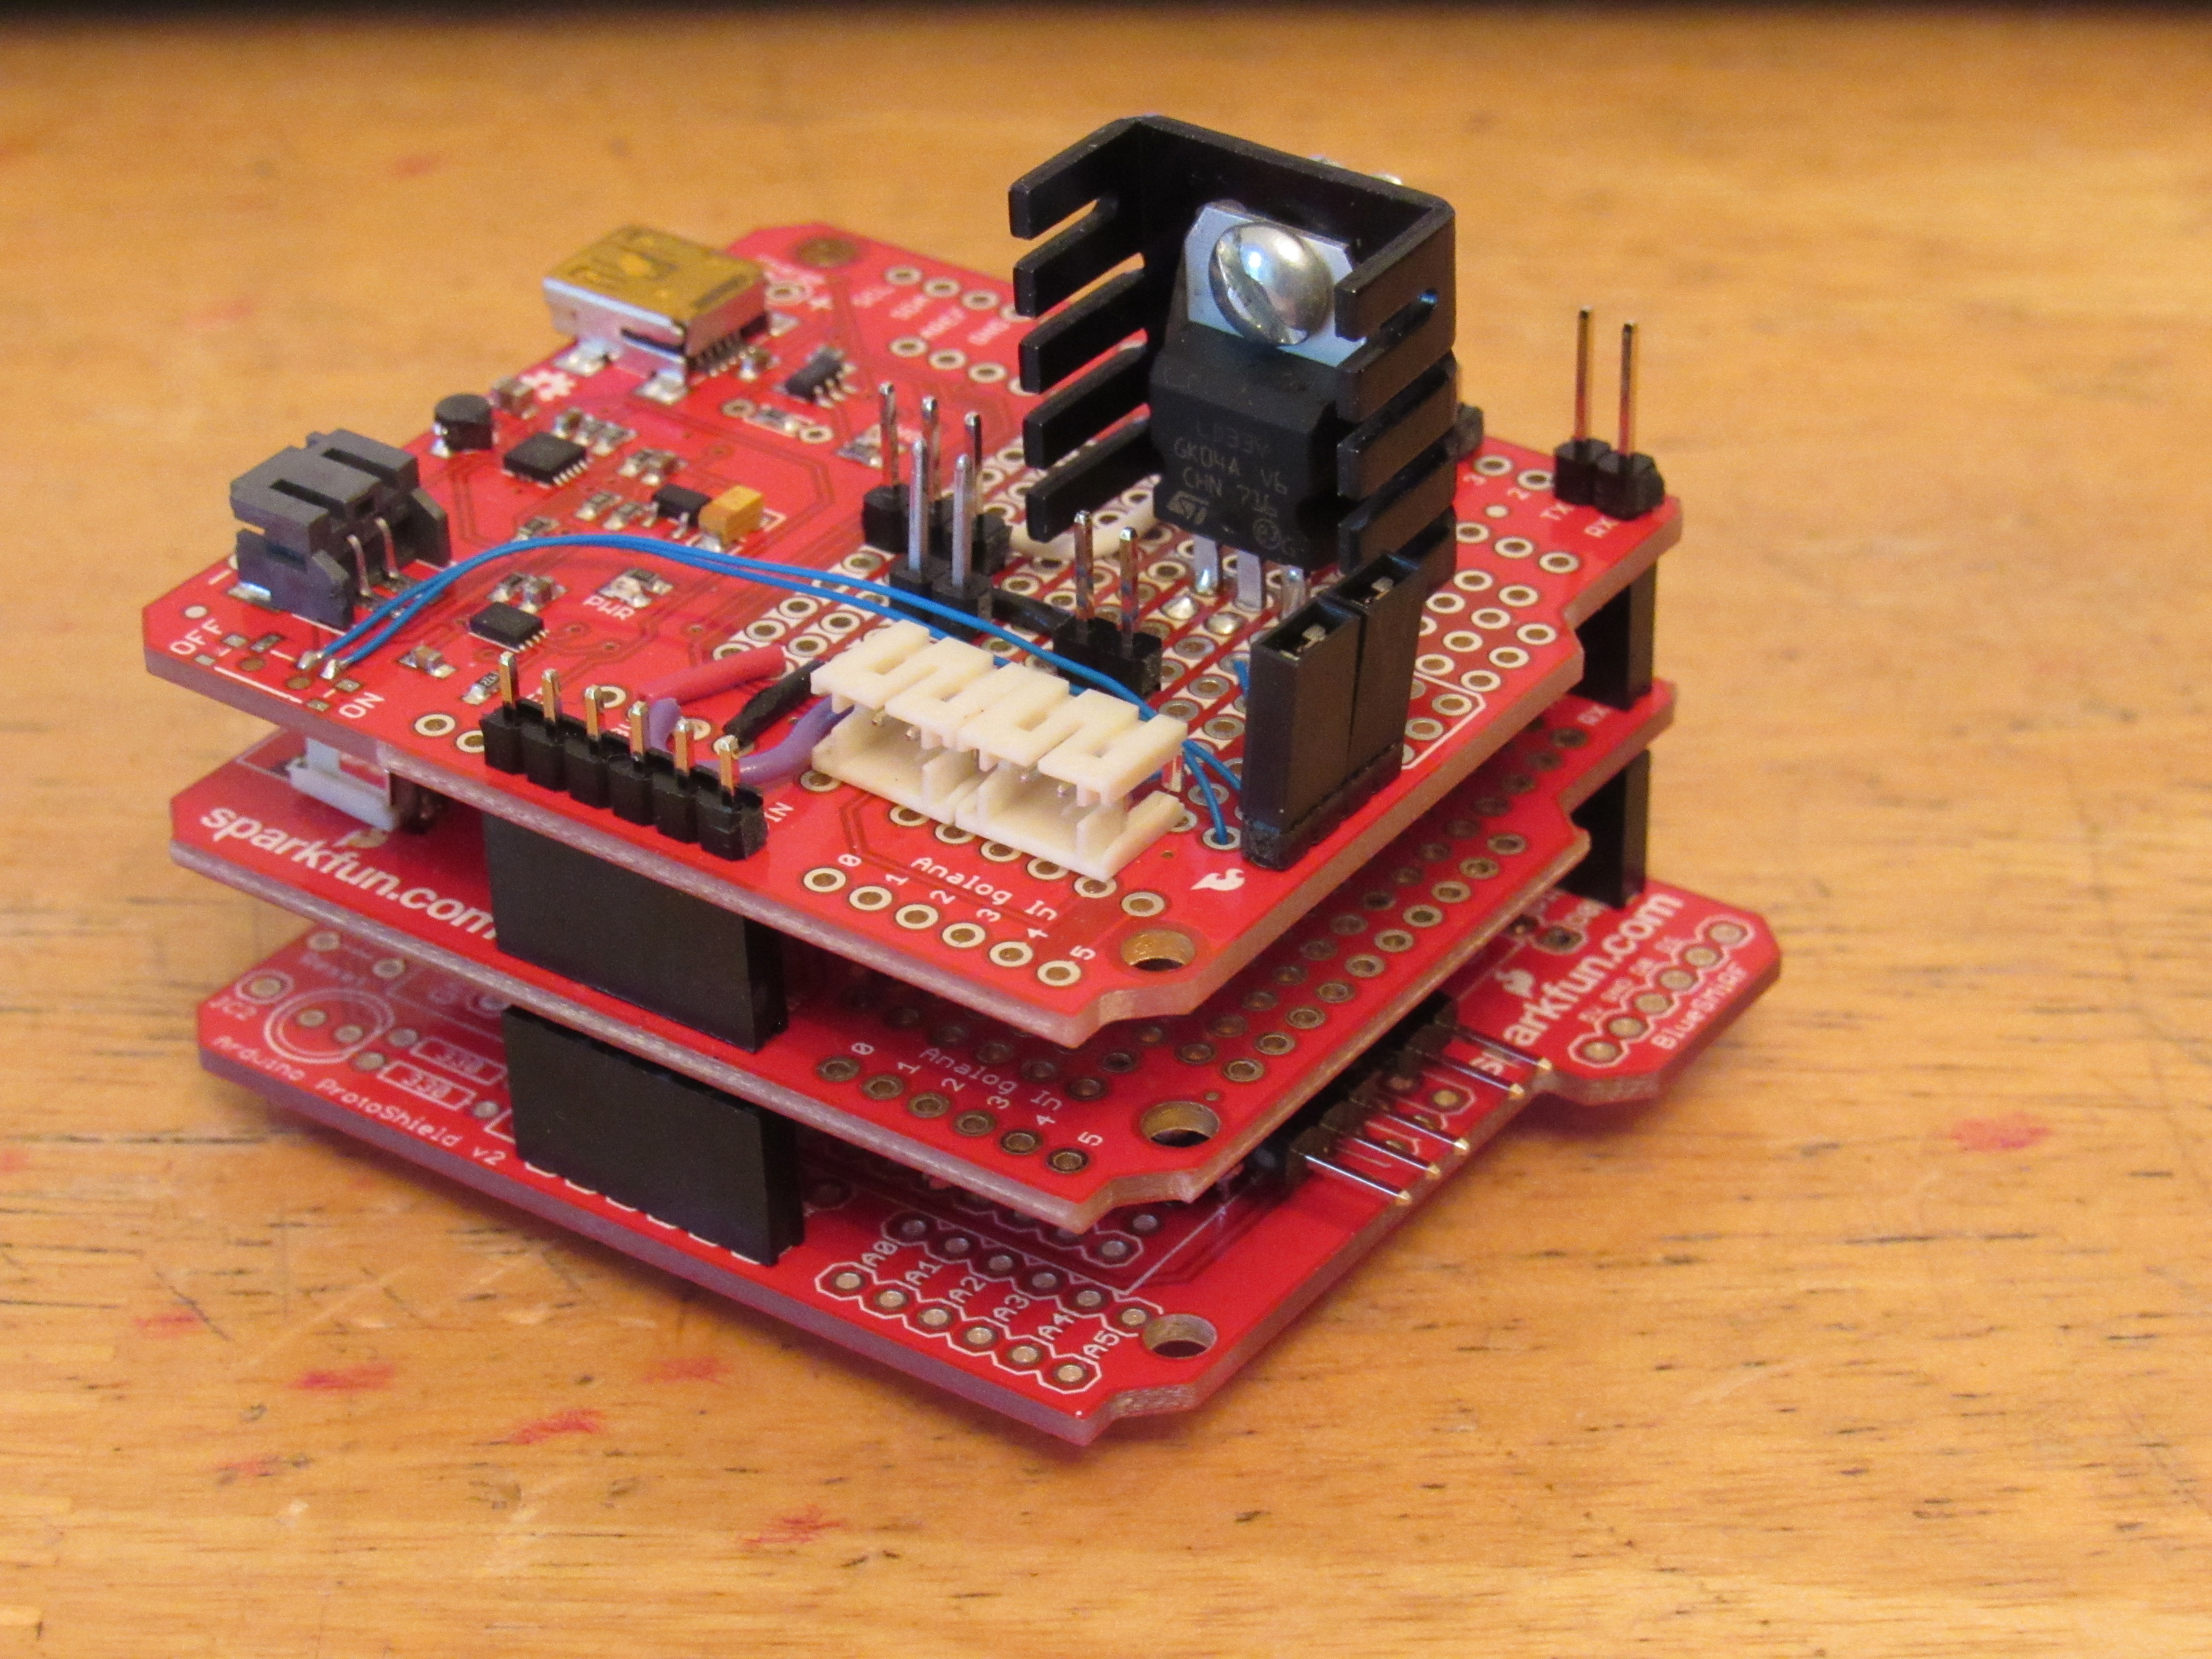
Lastly, the Lipower Shield (top board in the photo) I use for a different part of the payload stopped working. I believe I inadvertently caused a short somewhere.
The disappointing part is the amount of work completed in adding connectors and components to the board.
Setbacks are Motivating and Educational
The re-factoring experience helped me to step back and learn more about the radio, learn more about Arduino classes and pointers, and about how to confidently use components with different voltage levels.
The possible loss of a radio has me considering how to reliably connect pieces of the payload together so that they are flight ready.
The loss of the power supply motivated me to review the power budget, experiment with the life of the batteries, and raise my awareness of changes to a system.
Setbacks are frustrating but they are part of our business when creating unique, hand-crafted payloads meant for harsh and unforgiving environments. They throw down a challenge and we decide to pick it up.
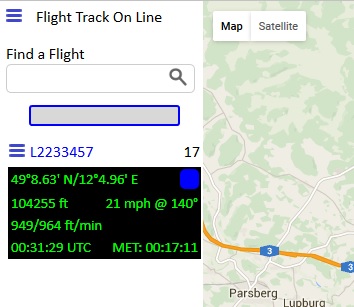
I invite you to explore Flight Track On Line for your next balloon flight! Or, explore it with any of the active flights (click on the hamburger menu and select Active Flights) that are plentiful at six hour intervals starting at 00:00 UTC.
FTOL Features
Payload Tracking
Payload Search
Active Flights
10 Day Flight Archive
Active Flights List (updated every 30 seconds)
Flight Information at Each Location
Follow Up to Three Flights
Predicted Descent Path
Displayed After Burst
Updated Every 3 Minutes
Graphical Activity Metrics
Distance Measurement Tool
FTOL Introduction Details
I have been using FTOL to follow flights for many months. While I believe it’s ready for everyone to use, I think there are opportunities for improvements and possibly an occasional odd behavior. For the features listed above, I ask for your indulgence and your feedback when you think of something that could benefit you and others, or if you find something odd.
FTOL replaces the desktop version. I released the Flight Track add-in for Microsoft MapPoint in 2010 and appreciated everyone who experimented with it. When my laptop gave out, it was time to step back and determine a direction for Flight Track. I considered tool stacks for development, and Microsoft was ending support for MapPoint (I understand it is not supported on Windows 10). I eventually settled on a web-based design and started implementation at the end of 2014.
The product is available for your use, entertainment (yes, I’ve spent some Saturday mornings entertaining myself with FTOL), and tracking!
Flight Track Online (FTOL) has been processing APRS balloon traffic for a few months. I last reported processing around 9000 packets per day. About two weeks ago, some of the regular call signs flying balloons in Europe doubled their flight frequency. FTOL is processing in excess of 30,000 packets per day. My little Raspberry Pi 2 takes it all in stride but I have ordered the newer Raspberry Pi 3.
You may notice a different look. There is some styling and I recently improved the search operation to mimic what one might see during a Google search. Type in a letter and the application displays a list of call signs that contain the letter. Lastly, I added a hamburger at the upper left to contain navigation to the Active Flights, Metrics, and other pages.
I would like to get some feedback and considered publishing the URL. However, I noted some performance concerns and wanted to investigate. If you are interested in reviewing FTOL in its present state, let me know by replying to this post!
In addition to investigating the performance, I still plan to add the predicted path in real time.
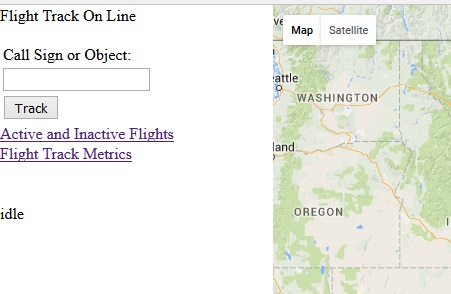
Flight Track On Line (FTOL) has matured since my last update. I include a screen shot of the interface with this post. Clearly, it is a functional interface (that means I haven’t styled it yet).
FTOL is an application to support high altitude balloon hobbyists in tracking their payload. In that sense, I log only those packets containing the balloon symbol (/O) in the APRS packet. In my testing (one of the funnest parts of this port), I have found that FTOL logs up to 9000 packets per day. I thought that was interesting so I include it and other metadata on the Flight Track Metrics page.
FTOL supports a search of the database. If the call sign or object is located, FTOL loads the flight information and presents the path on Google Maps. Alternatively, the Active and Inactive Flights page lists all of the active flights as links (I’ve seen up to 25 active flights on this page). Click on a link and FTOL starts tracking the flight in real time (I’ve tracked five flights at a time just by clicking on links from this page). While the link includes “Inactive Flights”, the final implementation is not complete.
FTOL would not be complete without real time flight path prediction. That idea has not been lost in the multiple database schema and stored procedures changes, performance considerations, and data surprises that have found their way into this journey. I have ported the algorithm and placed the path on Google maps once just to verify the concept. There is still a bit of work on that.
A friend of mine helped plan and launch a payload about a month back. I was saddened to learn they had not recovered the payload yet. They are hopeful that as the soybean and corn fields of Ohio enter the harvest season, or as the leaves follow their autumnal cycle, the payload will reveal itself. I wanted to help so I offered to review their data.
As with my flights and perhaps some of your flights, I think there are humbling moments that guide us towards better experiences. Upon one of my successful recoveries, I noted the antenna cable nearly twisted itself off. On another, a lift calculation error made for a slow ascent and a long, long day. Like I said, humbling moments that helped me design better payloads and fly better flights.
For their flight, they decided to use the Spot Tracker as the primary means of following the payload. I’m a fan of Spot and have seen it reliably used as a back-up, and used to locate a payload after APRS packets stop arriving. However, in this case, the Spot separated from the payload mid-flight and was recovered from a corn field a few days later. The payload was not found.
Their Spot logged 21 data points and the first six or seven were pre-flight (that is, on the ground). They also had the KML from the flight path prediction. I was able to piece together a likely flight path using the Spot data and prediction data. However, the resulting landing area was still tens of square miles. I could game the flight path by changing ascent rate, descent rate, or maximum altitude but gaming would not make up for a lack of key data.
Ascent Rate
The ascent rate would have helped to determine the altitude of the last Spot data point (the Spot does not provide altitude so I had to guess). I’ve followed many flights (I enjoy following flights and they are great tests for my MapPoint Add-In and Flight Track On Line) and guessed a rate between 750 and 1150 ft/min. I could employ the gas laws to make a better guess but did not have the volume of helium they used. In addition to altitude, ascent rate has some impact on the final landing site. In this case, a higher ascent rate moves the landing site north.
Descent Rate
The descent rate would have helped create a better flight path during payload descent. In this case, a longer descent placed the landing site farther south. However, it works better when the maximum altitude is known.
Maximum Altitude
The predicted flight path had a westward course above 65,000 ft. The payload would travel west until burst. The amount of travel impacts the landing site bringing it westward almost proportionally.
I was drawn into this hobby because of the engineering challenge. It also allows me to explore software development and testing in ways usually not possible in a large IT department. In turn, I believe it has helped improve how I develop and certainly how I test software. Every flight becomes a story, and stories help make GPSL enjoyable as well as educational.
If they find the payload, I’ll return to this post. Using just 14 data points during ascent with key pieces of information to predict a landing site may qualify for some sort of record. Amusing but I didn’t do it for a record. I’m happy to add an opinion that may assist in locating a lost payload. I’m most interested in the story from the payload itself. What will it provide that will make the next flight better?
Lastly, there are lessons above (no pun intended). It is not for me to point out right or wrong since I continue to be a student in the adventure of flying self-built or team-built payloads on the end of a balloon to the edge of space.
It all came together Saturday morning! Just as balloon teams around the continent were preparing for their flights, I was deploying code, updating code, and making final adjustments to track a flight with Flight Track On Line.
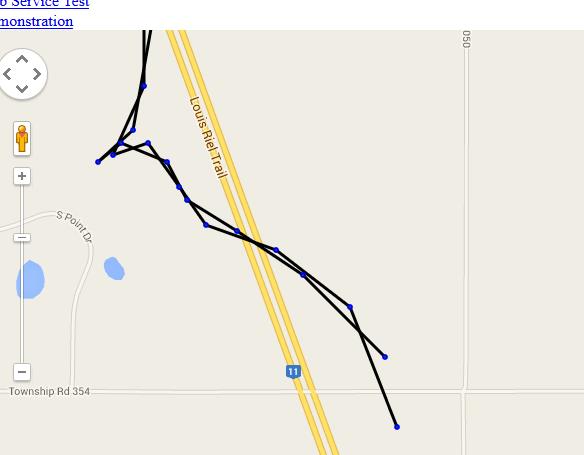
I followed a total of three call signs evaluating all components of Flight Track On Line – three on the same map! This is something I always wanted for the Flight Track add-in but I found the MapPoint API made it challenging to support. I started with VE5AA-11 from SABRE-22. After monitoring it a few minutes, I added VE5AA-12 from the same flight (possibly the same payload).
The screen shot below shows both paths. It also shows that I have to investigate why the path color is black instead of my design choice of green. I was fortunate to follow the flight long enough that a third launched in Illinois (KD9AUK-11). I had to zoom in and out to review the presentation of both flights but was happy to follow three call signs.
Behind the Scenes
The testing came to an end when the parse of packet data failed. I prefer to find errors like this when testing. It uncovered a deeper issue with some of the information transfer between the program capturing the APRS-IS feed and the web service.
Other interesting errors included primary key duplication, a need to centralize my database management code, and some unneeded parsing.
Next Steps
I started correcting these errors and improving the code. You might notice the lack of any flight information in the screen shot. I miss it also – I want to display packet data and rates just as the Flight Track Add-in does. But I want to be sure the core functionality is solid first.
I’ll be doing more testing on my local machine (a .NET web site interacting with a Java web service processing data to MySQL driven by a flight simulator all on one machine – I love this project) over the next week.
Soon after I published my plans to upgrade Flight Track through a port to Java, I received one or two suggestions from our community. One exchange inspired a Skype session where we discussed the possibilities of various platforms – desktop and web application.
One of my primary reasons for the port was the cost of maintaining Visual Studio. Within weeks of my post, Microsoft released Visual Studio Community 2013. After downloading and evaluating it, I decided I could use it to upgrade Flight Track and confidently support it through future upgrades of the IDE and my laptop. This was an advantage for since I can use existing Flight Track code in the upgrade. When I couple this decision with my platform conversation, I started the development of Flight Track On Line.
When I started the original Flight Track, I experimented with parsing APRS packets and displaying a location in MapPoint. Having already proved this to myself with the combination of HTML and Google Maps, I thought a better goal was to process the near real-time data from APRS-IS. In these experiments, a connection to the APRS-IS server was required – similar to how Flight Track operates today (Flight Track can monitor a radio or an APRS-IS server feed). However, when I deployed this to my website, my host was “cautious” about having an open socket connection on their server. It seems shared hosting is risk averse.
I thought I might be able to use a different source of APRS-IS data so I contacted administrators at aprs.fi and findu.com. While I came away without a solution, I have greater respect and appreciation for what they do and how they do it. I also received a suggestion to host my own solution.
Hosting a website on my personal computer was both intriguing and concerning. Dedicating the same computer for Flight Track On Line and high school homework would probably have an impact on both, and I had security concerns. About this time, my son had received his Raspberry Pi and, in addition to commandeering our television for his personal monitor, was talking about downloading a Linux distro.
After a couple of hours of setting up his Pi, we saw a GUI and some applications. He spent much of that evening building a Mindcraft world. Something in the set up caught my attention. In the midst of downloads, setting passwords, and learning Linux commands, there was an installation of Apache. There was also a picture of the default web page declaring “It works!”
I was familiar enough with Apache to investigate the Pi as a web server. Multiple code examples and methods of accessing it from the internet prompted an experiment. After a few days, my son and I found we could access the Pi in our living room from my website. At this point, you may be ahead of my story.
Yes indeed, I purchased my own Pi and started developing prototypes in Eclipse. The prototypes ported easily to the Pi and they even executed successfully. During a very geek-filled holiday break, I combined REST libraries, Tomcat, and MySQL to receive and store data from an APRS-IS server feed. In short, I believe I had the ability to monitor balloon flights in near real-time.
I have not put together enough code to follow a flight. All the parts are there waiting for a snowy weekend to be integrated and tested. Stay tuned!
I recently purchased a new laptop and with that is a set up effort. I installed Firefox, BeyondCompare, and other applications and utilities I collected over the five years since my last new laptop. These were the easy ones. One of the more challenging and educational was setting up Visual Studio so I could continue to work on Flight Track.
The Legacy of Old Tools
I have been using Visual Studio 2008 Standard for a long time. I still had the disk but the box indicated it was an upgrade. I recall at the time that you could download Visual Studio Express for nothing. I had done that but found it would not support add-in development (Flight Track is a MapPoint add-in). If I wanted to install Visual Studio 2008 Standard, I’d have to find Visual Studio Express.
I found it in a Downloads folder on the hard drive I used two laptops ago. What a lucky find I thought! I installed it, upgraded it, and even installed SP1. I transferred all of my projects and was working within a week’s time. As I told the story of my fortune to others, I thought I should upgrade. What are the chances of finding all the things I need? What if the tools are no longer compatible? A quick look for Visual Studio 2010 on eBay told me I would not be upgrading soon. What if I never upgraded?
That question, and possibly the bright colors of autumn, had me asking what I should do with Flight Track. I enjoy working on it and using it. There are a few other users for it. But, the thought of my tools growing old or unusable helped me to realize a change should be considered.
I think the ability to forecast a flight path and landing site in real time is valuable. I understood MapPoint was a barrier to use Flight Track and experimented with Google Maps during the summer. When I investigated methods of hosting an on-line version of Flight Track, the fact that I made calls to the APRS-IS servers would force the use of a dedicated server. Together, these events had me considering alternative development solutions.
The Eclipse Experiment
One of my first considerations was an ability to work across multiple platforms. This led me to Java. I briefly explored both NetBeans and Eclipse. I found Eclipse was a little closer to my experience in IDEs and started experimenting with it.
My primary requirements are:
Ability to embed a browser for hosting Google maps
Ability to communicate with radios or a GPS through a serial port
Ability to communicate with APRS-IS through the internet
I have others but these were the most important. I started earlier today with this list. By mid-afternoon, I had proven all of these were possible.
The Winter Project
I am looking forward to the challenge of porting the Flight Track functionality from .Net to Java. I’ll also take the opportunity to re-factor, re-consider, and re-design. Watch here for updates!